Navigating AppFaktors
Reports
Welcome to the Reports page. This screen provides an overview of your organization's technology landscape and offers access to various detailed reports.
To access the Reports page, click Reports in the left pane.
Key features
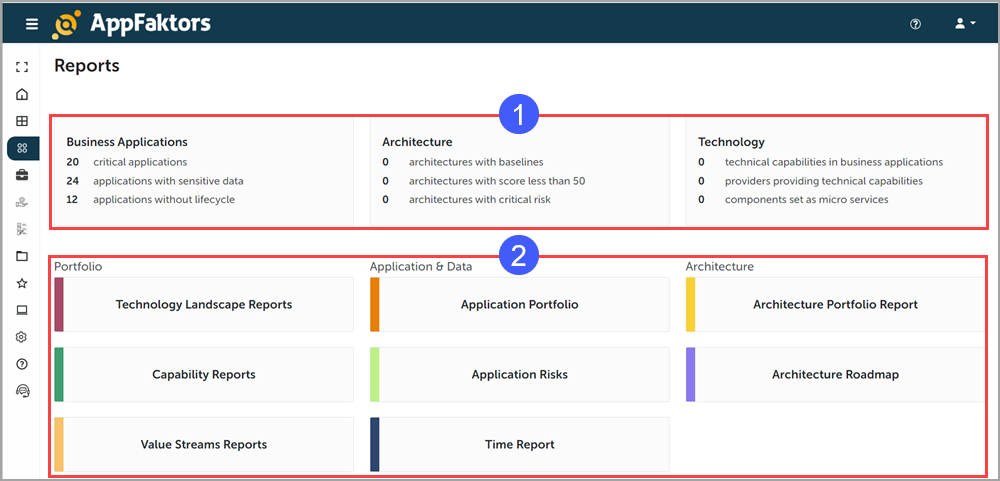
Overview Statistics: The top section displays key metrics across three categories:
Business Applications:
- Number of critical applications
- Applications with sensitive data
- Applications without lifecycle
Architecture:
- Architectures with baselines
- Architectures with score less than 50
- Architectures with critical risk
Technology:
- Technical capabilities in business applications
- Providers providing technical capabilities
- Components set as micro services
Report Categories: The lower section is divided into three main categories, each offering specific reports:
Portfolio:
- Technology Landscape Reports
- Capability Reports
- Value Streams Reports
Application & Data:
- Application Portfolio
- Application Risks
- Time Report
Architecture:
- Architecture Portfolio Report
- Architecture Roadmap
How to Use
- Click any report name to view the detailed report.
- Use these reports to gain insights into your organization's technology landscape, identify risks, and plan improvements.
- Regularly review the overview statistics to keep track of critical metrics.
Tips
- Pay special attention to critical applications and architectures with high risk
- Use the Application Portfolio report to get a comprehensive view of all your applications
- The Architecture Roadmap can help in planning future technology initiatives
- Capability Reports can assist in identifying gaps in your organization's technical capabilities
For more detailed information about each report type or for assistance in interpreting the data, please refer to the full user guide in the Help section or contact Support.